
Since I received a couple of emails regarding the sampling post, I'd like to mention an auditor's portal caled "AuditNet" and the publisher John Wiley. The AuditNet site has a link to an Excel file which calculates sample sizes for a variety of techniques. John Wiley publishers were the go to company when I studied sampling theory. I browsed Amazon and they have the classics (in used condition) as well as some newer books.
Click Here For More Information
Thursday, June 29, 2006
Monday, June 26, 2006
Ideal Usage Calculation-Major Hurdles
Any top 10 list of ideal food usage problems should include the open food key on your POS system. Take a look at your product mix report and find open food as a percentage of food sales. A worst case scenario involves over 10% of food sales attributed to open food. Less than one half of one percent is a good target. Your operation probably runs somewhere between these extremes. The higher the open food sales as a percent of total food, the lower your chance of success in calculating an accurate ideal usage.
Large buffet sales may hamper ideal food cost calculation. This is not the case in all operations. Many chefs are fantastic with buffet control. I've seen higher variances in operations with a high buffet sales component. Buffet recipes are tricky and many operators give up on developing a complex recipe model.
Menu item explosion can implode the ideal usage calculation. The more items on the menu, the lower the chance of accurate food cost prediction. Focused menus with very few specials represent your best option. When it is impossible to offer a menu with a tight focus, try to view your menu in logical sections. These sections should focus on a particular food category (e.g. steaks, seafood, etc.). Some sections will be more kind to the recipe team. Calculate a separate ideal usage percentage for each section.
In general, the greater the yield variance in producing an entree portion the lower the probability of accurate ideal usage calculation. Try a simple exercise. Take 90 days of purchase history on any large meat cut used to produce a popular menu item. Simply enter the weights per piece in a column of a spreadsheet. Calculate the average weight per piece and the standard deviation. As the standard deviation expressed as a percentage of the average weight increases, your chance of accurate standard recipe creation declines. Consider portion control items whenever you experience huge variances in usage on entrees cut from large meat cuts.
If you develop each day's menu in the morning at the market, your chance of accurately predicting ideal usage may be zero. I have never seen a market driven menu with a tight difference between actual and ideal. The higher the percentage of sales generated by specials, the lower your chance in consistently hitting an ideal number. Production and prep activities will be closely tied to your purchases. Actual sales may differ widely.
Low sales volume will hinder any attempt at ideal usage calculation. Combined with an unwieldy menu, low sales volume can spell disaster. When the sales are extremely low, all efforts to control costs should take a lower priority. Your menu strategy is failing and the market has spoken. Try a smaller, easier to produce menu and get the word out in the press. Offer some promotions and solicit customer criticism. Go with the winners and cut all the menu dogs.
Consistent food cost results are a function of logical menu mix, tight menu focus, excellent POS menu setup, limited specials and buffets, predictable portion yields and a profitable sales volume. If your attempts at ideal usage calculation have been disappointing in the past, examine your operation and eliminate the obstacles to success. Find the ingredients which are always in the top variance list. Make an easier to track production method for these problem items. Better results happen one ingredient at a time.
Click Here For More Information
Tuesday, June 20, 2006
Perpetual Inventory-Stratified Random Sampling
My final review with the RCA Corporate Audit staff involved the Accounts Receivable sub-ledger at the global telecommunications subsidiary. By the time I was asked to help, the job was already over the budgeted time and everyone was under the gun to get the report to management. To keep costs at a minimum, I requested interns from Rutgers Graduate School of Business.
During training conducted by the Arthur Young CPA firm, I became the statistical sampling "expert" when I corrected the instructor on the final day. Arthur Young had an excellent sampling tool and I asked my boss if we could try stratified random sampling to help with the project deadline.
Basically, a stratified sample focuses more attention on higher impact accounts (in this case customer records). We examined the printout of sample selections and found we were to examine the top 5 customers and a representative sample from each of the other strata. I won't discuss our results but I was promoted based on the report findings and the relative speed in which we concluded the review.
Many of the benefits of stratified sampling may be utilized in operations where a strong reliance is placed on perpetual inventory calculations. People using perpetual counts often need to make spot checks to verify the results of the ideal usage formula. So what items should you spot check?
I would recommend checking every item in your top 25 purchased goods list. Since you won't be scrutinized by Arthur Young accountants, it's up to you to decide how many additional items need checking between physical counts. To give you an idea of the power of sampling, we used around 350 accounts in a universe with tens of thousands. Our limited review located critical control issues and we brought them to management's attention in a timely manner.
If you have 1,000 items in stock, check 5 or less shelf stable dry goods. With your top 25, this will make 30 items. Try to randomly check another 25 to 50 (depending on time required). Now the fun begins as you try to reconcile the perpetual inventory level calculated vs. the actual amount on the shelf. The first five or six spot checks will point out obvious recipe errors and yield issues. Since you're sampling you should expect problems found for a particular class of items (for example produce) may require more intensive work on the entire class.
When you find a problem with portion control items and the recipes are solid, note the dates of the last physical count and the spot check date. Mark any of these problem items for increased scrutiny. You may consider control sheets located near the walkin coolers and freezers.
The use of spot checks and sampling techniques will greatly improve results in operations where physical counts are required monthly. If you count everything each week, your mid-week spot counts may be very brief and focused. Some operators count the top 25 daily. This should suffice for most weekly count operators.
An excellent additional benefit of perpetual inventory spot checks is the refinement of recipes used in the calculations. Accurate recipe costs and ingredient yields are requirements in more sophisticated menu engineering calculations.
Click Here For More Information
Friday, June 16, 2006
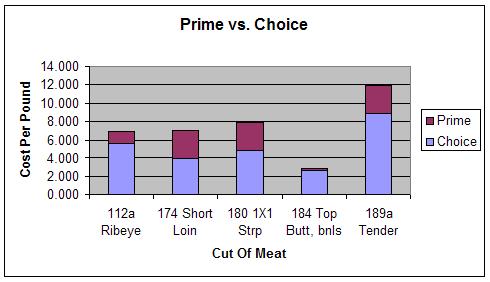
Prime vs. Choice
I decided to take a look at the price differential between prime and choice grades for the popular beef cuts. The NAMP numbers for the 5 cuts are 112A, 174, 180, 184 and 189A. My source is www.foodservice.com and I used market data from early 2005 through this month. The sample includes every fourth report and my prices represent the averages. The chart shows average market cost per pound for each cut.

Porterhouse Steaks cut from prime Short Loin 174 cost 80% more than choice. New York Strip Steaks cut from prime Strip 1x1 180 cost 62% more than choice. Tenderloin looks like a bargain. Prime Tender 189A costs about 34% more than choice. Finally, a prime Sirloin Steak cut from a Top Butt 184 will cost about 8% more than choice.

Click Here For More Information
Thursday, June 15, 2006
One Dollar of Food Cost
In an earlier post Purchasing Dollar vs. Food Cost Percentage , the topic of dollar analysis of food cost was explored. When I say "dollar" in this context, I am referring to an entire year of food cost expressed in terms of one dollar.
There are many interesting ways to look at one dollar of food cost. One of the easiest starting points is vendor analysis. Find out how much of your food cost dollar is spent with each vendor. If you want to improve your overall results, start out with the top 3 to 5 vendors. Could competitive bidding or market-based pricing contracts help lower your costs with these high volume vendors?
You may want to answer this question with a more in depth view. A simple matrix could be used to analyze the dollar value by vendor for each major cost category. Every operation has certain categories which stand out. Steak houses would have a major part of their dollar spent with butchers and meat suppliers. Mexican concepts and pizzerias spend big amounts on dairy products and sauces. The dough ingredients and tortillas are high on their list.
The matrix would have a row for each major category. Many use the following categories: meat, seafood, produce, dairy, dry goods, frozen goods, breads and baked goods. I recommend a more focused list. A QSR chicken concept might have a category called fryer items. The actual ingredients in the category could include chicken tenders, frozen fries and the 35# containers of fryer oil. A pizza concept might have dough components, sauce components and toppings as their rows. Try to visualize the operation by production function.
Your top 3 to 5 vendors would make up the columns.
The entire matrix should equal one dollar. Find out which vendors supply you with the ingredients used in each phase of production. It's common to find cells in the matrix with values greater than or equal to a quarter. These cells are high impact activities. Focus your attention on these areas and vendors first.
On the other hand, there will be many cells with values below five cents. Don't devote excessive time on these activities. The use of flour would be a low level activity in many operations. If you make pizza dough or have a major bakery, flour could be part of a major impact cell.
Rank the cells and attack the big parts of your food dollar first. You'll get results faster with less effort.
Click Here For More Information
Friday, June 09, 2006
Market Segmentation - Best Practices
Over time, I have observed many segments of the food and beverage service industry. My observations have included hotels, restaurants, clubs, schools, jails, health care facilities, remote sites, markets, event caterers, and race tracks. Without fail, each operation exhibits a specialty when cost of goods sold and inventory control are the focus.
The best practices I've observed do not represent any scientific study and I have no statistics to support my opinions. These are gut feelings which are the result of many years of observations. I hope you find them useful in your organization. Before adding any of these control features to your operation, make sure the cost justifies the benefit.
Hotels
Hotels are typically adept at inventory control and profit center reports. Most hotels have a central receiving area. Movement of product from central locations is tightly controlled using requisitions and transfers. Some hotels implement an approval system with order limits for each purchase category. They setup strict guidelines for approvals.
The best run hotels can tell you how much of each controllable is on hand at a given point in time (by location).
Hotels are frequently buffet shops and many have at least 40% of food sales in banquets and buffets. This high level of buffet activity helps keep waste at a minimum in the well run operations.
Restaurants
The best run restaurants have a focused menu and they know their customers well. Some actually create table profiles and they can quote statistics on average check by meal period, average sales per table by meal period and by wait person. A few top level f&b controllers know table profiles and use these in demand forecasts.
Restaurants tend to be adept at specials and the best do a fantastic job putting extra profits in the cash register. Today's POS systems have a battery of focused sales reports which help managers price menu items and track usage.
Clubs
Clubs are often hybrid operations with both restaurant style service and banquet service. The best clubs do a great job segmenting the two operations. Purchasing demands a knowledge of the entire operation. The best club managers are aware of upcoming events and seasonal restaurant trends. I'll discuss ordering for events below.
The members of any club are the focus and many members are regulars. This fact accounts for a more stable forecast model. Knowing the clients intimately helps to reduce waste caused by over ordering perishables.
Institutional Caterers
At Sodexho, we served clients in remote construction and mining sites, health care, business and industry and education. To a lesser extent, we fed prisoners in a small number of jails. Contract feeders and self-operated institutional accounts are driven by cycle menus. These contract menus specify menu options for each meal period in a four or five week cycle menu. This activity is dominated by firms with highly automated systems for tracking item usage. Brand name items often attract rebate income. Institutional feeders are wizards at setting up rebate programs and monitoring their results.
In my role with Sodexho Canada, I setup rebates for coffee, paper, chemicals and other high volume, rebate sensitive items. These rebates accounted for 2.5% of food purchases.
Some savvy self-op shops establish relationships with manufacturers and generate rebate activity. Even though each single account may not have the typical volume required, buying groups allow these single operations to combine their volume to hit a critical mass.
Institutional food service has two huge advantages: menu is fixed and demand is easily estimated. Sometimes, brutal competition for top accounts places a huge demand on the cost control system. The benefit of this tight control is achieved on contracts gained through less stringent conditions. High profits are bagged through implementation of the same tight control systems.
Markets
Take home food is a fast growing area and the super markets have created special areas to promote this high profit activity. Although these venues may help minimize waste of perishables in the produce, deli and meat aisles, many top market operations produce items in separate facilities with ingredients purchased specifically for this purpose. Like any food and beverage operation, they benefit from larger volume purchases and purchase #10 cans instead of the smaller sizes purchased by super market shoppers.
These operations often use the new outlet to promote higher quality goods and they charge higher prices. The best run operations sell their finished goods to the deli, baked goods area and produce managers. In a complete twist, they supply the market more than they "buy" from the market.
Event Caterers
The event caterers know how many are to be served and the exact menu items required. These operators try to buy just enough to produce the menu for the event with a minimum of waste. Event reports highlight the count, menu items to be served and raw ingredients needed to produce the finished products.
With tight control of purchases and next to nothing purchased for par, low percentage food costs are the norm. Buffets allow these artists to use small leftovers from previous affairs with common starch items and salads.
Race Tracks
I grew up in Saratoga Springs and I worked for Harry M. Stevens. This company was founded by Mr. Stevens when he went to Yankee Stadium and couldn't buy a hot dog. During my college years, HMS was the top concessionaire for many sports facilities and one of the founder's grandchildren married into the Gulden mustard family.
In addition to lots of hot dogs, beer, soda, fries and chips, Saratoga Race Track served an excellent clam chowder, corn on the cob, clams on the half shell and specialty drinks. Concessionaires know their operations well and they plan weeks ahead for major events.
In Saratoga, we have the Travers Stakes race and there are many huge sporting events annually in the country. Now the NASCAR racing circuit produces huge events each weekend. The Triple Crown and Breeders Cup Day are big horse racing events with huge turnouts.
Concessionaires in New York ship employees from Aqueduct in Queens, Belmont Park in Long Island and Upstaters from Saratoga to create well trained staffs ready for these major days.
Overview
Each operator tends to focus on the business model of the particular segment. This focus brings certain specialized strengths into play. It has been my privilege to see so many different segments over the years. I often wonder what food cost percentage could be achieved with the best people from all these diverse areas of the food and beverage universe.
Saturday, June 03, 2006
Ideal Cost of Sales - Decomposed
In the last 15 years, I have worked on over 200 projects to determine ideal usage and ideal menu item prices. In candor, most firms lack the proper operations information to explore the ideal cost issue. While the technology has completely transformed the reporting environment, the lack of standard recipes, standard yields and standard production information is widespread.
At the very least, every operator should know the portion sizes for all top menu items. I always say: "Pretend you just hired me as a line cook. Where do I go to study the portion guidelines for the really popular stuff?" A surprising number of managers answer: "You need to ask the people your working with for the guidelines." Leaving key portion size information to informal word-of-mouth communication is a mistake.
Take your top 25 purchased items. For each item, create a yield sheet as follows:
Cost of purchased weight:
As purchased weight:
Primary purpose yield:
Secondary purpose yield:
Trim yield:
Bones yield:
Unusable weight:
The cost for both the primary purpose yield and secondary purpose yield depends on your ability to make use of the trim and bones. If you have no use for either trim or bones, do not give a dollar credit in the analysis. A conservative model would also give a zero credit for these weights. A more aggressive model would assign a credit for the trim and bones based on the actual cost of buying each from the butcher. Do not assign a credit for trim and bones using straight weight calculations.
Costing the primary purpose yield and the secondary purpose yield is at the heart of this analysis.
I was in the local Costco today and boneless ribsteaks were selling for $7.49 per pound. Recently, I had purchased a bonein rib roast for $4.99 per pound. My best guess on the trim level of both cuts made me happy I had made the buy at $4.99. The bonein roast looked like it was cut from a 109C and the boneless steaks looked like they were cut from a 110. The difference in weight is a ratio of 80% usable on the bonein. If you want a perfect 112 ribeye, 50% loss from a 110 is possible and you would pay up to $9.98 in my example.
Since I paid $21 for my 3-rib roast and I cut three thick rib steaks, my cost of $7 per steak was a second check. In deed, the steaks at Costco would have cost me $8.25 each.
Early in my consulting practice, I worked with a fantastic person with formal butcher training and lots of experience. He bought beef rib after carefully studying the various market options from 3 suppliers. His typical spec was 109D or "exports" as they are called. Occasionally, he would buy the 109 or 110. In his operation, he served both prime rib and rib steaks so he often purchased more than one cut. His butcher shop had all the proper equipment.
Some of the decisions he made would produce a savings of 10% to 12% for the same menu item during the same week. Since these menu items accounted for over 20% of his weekend business, these decisions put him at a big advantage to his competition. He always passed along the savings to his customers in the prime rib since this was a market priced special on his menu (offered only on the busiest nights).
In the years following this project, I observed many restaurants offering prime rib and rib steaks. Many operators offered prime rib on slow nights, bought the meat from a single supplier and always bought the same cut. Seeing the unserved leftovers in their walkins was my first red flag. The lack of serious yield analysis was the second red flag. Finally, the majority had no clue what the gross margin was on these very high cost menu items. It was no wonder they called for help.
An operation with poor forecasts, no formal yield data and a complete lack of competitive bidding in place can easily pay twice as much to serve the same menu item. The great reports now available show the variances clearly. Ironically, the majority of operators using an ideal usage report look at super high variance ingredients with suspicion. "This can't be right!" "What is this telling me?" and "How can you believe this stuff?" are common replies.
Click Here For More Information
Subscribe to:
Posts (Atom)
Restaurant Data Pros


