
Many companies take a serious look at central production. The prospect of better consistency and the opportunity to run larger batches lure too many of these companies into a trap. Recently, I observed the final meetings for a single unit operator expanding to a new commissary with capacity to handle production for 5 additional units. The owner wanted a new control system to handle the increased demands of his expanding business.
Unfortunately, it was far too late to offer my views on commissary construction. The long term lease was signed, construction was nearing completion and heavy equipment installations were in progress.
The new commissary opened and the organization is bleeding red on the bottom line. With the commissary draining funds each month, the chance of starting any of the new units is remote. Break even sales volume seems out of reach despite strong growth. So what went wrong? This was a successful single unit operator enjoying better than average unit volume for the region and decent sales growth.
The strategy here is flawed.
Creating the capacity to handle production for 6 units with only one unit operational is suicide. The new monthly fixed costs are too high, production workers spend too much time walking around the mammoth kitchen. Freezers and walkins designed to handle five times the current volume have raised the monthly utility bills. The fleet of vans has increased to handle movement between locations. Sales barely cover the fixed costs and wages.
Rather than wasting the owner's precious time (he works 16 hour days - 7 days a week), I told him he needs to focus on volume rather than food cost control. His sales are too far below break even to worry about incremental food cost improvement.
I'll be working with a different company in the same region. They just opened a new unit in this hot growth area. Sales are double their average unit volume and the operators are feeling the strain. Fortunately, profits and cash flow are robust.
Wednesday, December 20, 2006
Saturday, December 09, 2006
Food Cost Control - Alphabetic Approach
Manufacturing companies often segregate their parts inventories into A, B and C groups. The parts in Group A are used in high volume and are expensive. Group B has two types of parts. The high volume, less costly parts would fall into the B group. Also, expensive parts used in lower volume would be in Group B. Finally, Group C parts would include the largest number of members. These parts are inexpensive and used in low volume.
Why stop with only three letters?
I'd recommend segments for product shelf life and I wouldn't use Group B for two profiles. Let's use Group A to include highly perishable, costly, high volume items. If a costly, high volume item is purchased frozen, we'll use group B. Group C will include all costly, high volume items which are shelf stable.
Following this approach, we'd use groups D, E and F to handle moderate volume items. The perishables would be coded to Group D. Frozen would fit the E profile and the shelf stable would go to Group F.
Since the 80/20 principle is in play in most kitchens, you'll be left with lots of items in groups G, H and I. Use the perishable/frozen/shelf stable structure to complete the grouping exercise.
A 1,000 item inventory will contain about 200 items in the first three groups. The next three groups will have from 150 to 200 items. All the other items will fall into the last three groups. You'll find very few items in Group C vs. Group I. Perhaps coffee and oils will be in the C group and the spices down in Group I.
When you are finished with this exercise, start to spend more time and energy with the first 5 groups. The last four groups will have the majority of items and the least amount of opportunity to favorably impact your food cost percentage.
Click Here For More Information
Monday, November 27, 2006
Constructing The Value Menu
Back in 1992, New York City hosted the Democratic Party Convention. Many of the restaurants offered a special menu for $19.92 to the conventioneers. I worked with several chefs to create profitable menus given the $19.92 constraint. This exercise helped these chefs to continue offering full meal options well after the convention ended.
The best place to begin a value menu is with your most popular entrees. Any menu revision impacts the popular items more than the less popular choices. Rather than taking guests in a different entree direction, allow them to enjoy a more complete meal.
Every operator should know the profile of menu choices per cover. This profile includes the percentage of covers choosing a starter, entree, dessert and coffee course. If you enjoy a large percentage on starters and desserts, you may wish to avoid offering the table d'hote option.
Most table d'hote menu authors include a dessert and coffee course. The dessert options include 2 or 3 low cost items. These items are frequently offered at cost - 100% - to the guest. It's important to properly cost the dessert and coffee course.
The entree course often includes a slightly smaller portion size for the center of the plate choice. Since the diner will have a starter course, the smaller entree portion size will suffice. Try to develop a starter course with a cost equal to the savings on the center of the plate portion.
For example, a well trimmed filet mignon steak may cost $1.00 to $1.50 per ounce. If you reduce the portion from 8 ounces to 6 ounces, you'll have $2.00 to $3.00 with which to create the starter course.
Include the same vegetable, starch and bread courses as the base menu.
To cost the table d'hote meal you'll start with the entree price on the menu. To this number, add the price of the lowest starter course on your menu. Finally, add the cost of the dessert and coffee option (try to keep below $2).
If you charge $25 for the entree and your low cost starter is $5, the table d'hote may be offered for $32. The additional 28% rise in revenue over the entree will produce a very good food cost percentage. The cost of the starter is covered by the decrease in entree size. We have included enough revenue to cover the cost of the dessert and coffee.
You're a winner if the overall check average increases. Track this statistic by day of the week to fine tune the table d'hote strategy.
Monday, November 20, 2006
Value Added Meals
In lieu of cutting menu item prices, many companies decide to bundle several popular menu items into a value meal. When I lived in Montreal, we often ordered the table d'hote option at dinner restaurants. These prix fixe dinners typically included a soup or appetizer, an entree with vegetables, dessert and coffee. If ordered separately, the total price of these menu items would be higher than the house's suggested meal.
Customers may actually spend more money on the table d'hote option. Most people do not order four or five courses during their restaurant visits. By enticing these customers to order a full dinner at the reduced price, the savvy manager may exert an upward pressure on the check average.
If you can change the dynamic and increase customer spending through a perceived value meal, higher revenue and increased cost control may be the result. Prix fixe options are typically limited. Restaurant managers select the table d'hote options carefully each day.
In addition to attracting more dollars from current clientele, new customers may try your restaurant.
The QSR segment offers both value meals and value menus. Value menu boards are loaded with many low cost selections which may be combined to create a meal. Their value meals are constructed around a larger beverage and an extra item (usually fries). Value meals have a set price. The value menu board options may be ordered in any number the customer desires.
I like their value meal strategy far more than the value menu boards. You can work hard to construct attractive and profitable table d'hote meal options. Your check average and food cost will be more predictable and stable.
Monday, November 06, 2006
Cost Benefit Analysis
Every business decision has a cost associated with the execution. If the strategy was sound, the benefit derived from the action will exceed the cost incurred executing the tasks. Cost benefit analysis involves the study of results in relationship to the cost of the activity.
The absolute rule (applicable in all cases) is the cost of information may not exceed the expected gain. Any decision which will produce a benefit less than the cost to make the decision, execute the strategy and monitor results is a waste of time. Most decision makers try to filter out the minutiae in order to focus their attention on high impact activities.
As you start any campaign to improve profits through improved food cost control, it is imperative to discover areas which will have the greatest impact for the time and resources required. Try to locate activities which are performed over and over again. Isolate activities which are not consistently performed and activities which have a major impact on the client experience.
A second rule is to avoid destructive cost cutting activities. For example, you may discover the most popular menu item has been chronically over-portioned by the production staff. It would be quite dangerous to dramatically cut the portion size back to the standard in this case. Customers have come to expect the bigger portion and will immediately notice severe reductions. It is wiser to acknowledge the true portion size and develop a less obvious strategy to deal with the issue.
Opportunity cost looks at both missed opportunities and the risks avoided. You have some extra capital to put in play. Do you use it as a down payment on a new location? Would a new advance in POS technology offer a big opportunity? Would an advertising campaign bring more covers to existing locations? These decisions all involve risks and they also involve opportunity costs.
If you do nothing, the money goes into a bank account and earns 2 to 5% interest. This simple activity produces a key decision variable - the risk free value of money. All decisions should be weighed against this risk free return.
Every decision you make needs to be one you are authorized to complete. The organization does not need the wait staff fretting over the selection of a vendor for a new phone system. If you stick to your area of control, you'll have a better chance to make great decisions. If you begin to look at your operation through the CBA lens, you will begin to overlook insignificant issues and focus on real problems and opportunities.
Click Here For More Information
Thursday, October 26, 2006
We Don't Know Our Costs
My boss at Sodexho always said "We don't know our costs." whenever the food cost percentage was too high. Generally, the remote site feeding business should be very predictable. Patrons live onsite and have zero options outside the dining room at the camp. If a room is occupied for a night, we'd expect the resident to show for breakfast, lunch and dinner. Straight forward revenue calculation involves the number of people in camp multiplied by the rate per person per day.
Problems in this business segment occur at mature projects after contract renewal. Since the competition is fierce, operators look for every possible advantage. When responding to the RFP, the bidders try to gain a cost advantage over their competitors.
If the camp is close to a urban area (close would typically mean a short flight), many of the residents leave on the weekend. Playing the game involves predicting the probability the Friday evening meal will NOT be attended. In addition, Sunday dinner attendees provide a full manday of revenue. Even weekend travelers provide an operator with revenue if they eat Sunday dinner (though no bed was made and breakfast and lunch were not consumed). Sounds like a bonus for the caterer.
Many times, the initial bid prices have this favorable activity built into the price matrix. Now the bonus turns into a risky game. Bad weather, overtime pay opportunities and special events may keep residents onsite over the weekend even though the prices reflect more checkouts.
Some of the best operators provide a fantastic Sunday night meal and advertise the menu during the week. All efforts are focused on a big turnout. When the residents do not leave as expected, Sunday costs per manday can be very high.
A few years ago, Darden's stock went lower due to a major turnout at their all-you-can-eat seafood buffets. Higher patron counts actually hurt their bottom line.
I have found many of my clients pushing menu items with ideal food cost percentages over 50% (some over 100%). It's tough to make a decent profit when you're not charging enough for your popular menu items. When my clients were wrong on the low side, they tended to be wrong on the most popular items. Savvy patrons recognize a value and order these lost leaders more frequently. Do you know your costs?
Tuesday, October 17, 2006
Selective Menu Revision
If the higher fuel prices and dropping home values are cutting your covers, you may still see full dining rooms on the traditional busy nights. Keeping the menu intact will allow a baseline business volume to be established each week. Try to use the revenue from these nights to cover all fixed expenses.
Cut fixed costs to the bone.
On the slower nights, use cost-volume-profit models to determine special prices. If your fixed costs are already covered, you could afford to offer free appetizers, two-for-one entree deals, a free glass of wine, prix-fixe menus, etc. (early in the week). You absolutely need to understand and cover any variable costs.
If you know your key cost components through standard recipes and tight flex schedules, it's easier to target your lost leaders. For example, don't choose labor intensive entrees for the two-for-one specials. Any specials should use ingredients with stable pricing which fit your menu. Avoid menu specials which require long prep times and precise forecasts (e.g. prime rib or other slow cooked roasts).
You could offer busy night customers an incentive to return during the slower nights. Special offers could be included with the check.
When I travel in the evening, I often swing by client operations on my way to the hotel. Many times I see employees at the bar late in the night consuming drinks and food. Zero patrons in the dining room should signal it's time to close the door. Cutting dining room hours on slow nights is a win-win solution. Service employees avoid longer hours for little pay, the kitchen staff gets extra rest and management saves the added labor and overhead expenses.
In summary, stable menu prices will allow you to cover overhead costs with your busy night customers. Slow night tactics (discounts, flexible cost strategies and selective incentives) will put profits in the bank.
Thursday, October 05, 2006
Avoid Slashing Your Menu Prices
Economic conditions are rapidly changing with worldwide demand for energy at an all time high and rising interest rates in the USA. Higher costs are functioning as a tax on discretionary income. Borrowers and drivers are paying a lot more for money and gas. Restaurant expenditures often depend on patron's discretionary income. With the home equity line of credit option disappearing rapidly, credit card expenditures will be tightly monitored by more consumers.
Recently, I went for a walk on a Wednesday evening at 8 PM in my neighborhood. I passed by 4 restaurants and dining rooms had lots of available tables. The best of the four was a popular chain steak house concept. Let's try to put ourselves in the shoes of management.
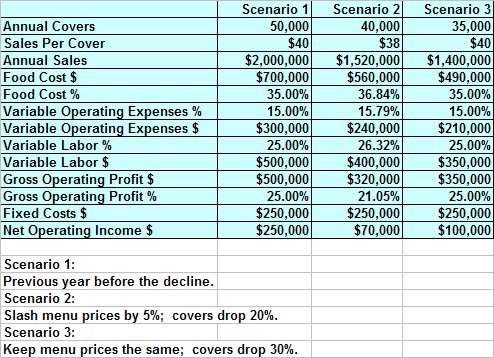
Last year, our example steak house had annual covers of 50,000 and sales of $2,000,000. Covers in the current month are off 30% vs. the same month last year. The current average sales per cover is $40 and management is studying options.
One manager favors a 5% across the board cut in menu prices. The hope is to keep the drop in covers at 20% vs. last year. Sales would drop to $1,520,000 and the food cost % would increase 1.84% (to 36.84% up from 35%). Labor expenses and other operating expenses are forecasted to hold at the current cost per cover.
The general manager sees danger in the drop and favors holding menu prices at the current levels.
So who has the better plan?

Across the board menu price cuts are always risky. As covers decline, we would also see a drop in the contribution per cover. This is a very difficult plan to manage.
I prefer the GM's solution. No menu reprint is required and there are plenty of tactical options available. Selective price drops may be implemented using specials to promote entrees using lower cost seasonal ingredients. Specific days of the week could be targeted for selective price cuts. As long as the covers on busy nights and busy seasons stay close to plan, the strategy will succeed.
In our example, the GM's solution would produce a higher profit despite a steeper drop in covers. A 5% cut in sales per cover would not produce a bigger profit despite 5,000 more covers. The drop in sales per cover of $2 is not a simple to implement strategy. All income statement accounts would feel the impact. Waitstaff would see their tips per cover decline. Careful study is needed to predict the impact on your operation.
Recently, I went for a walk on a Wednesday evening at 8 PM in my neighborhood. I passed by 4 restaurants and dining rooms had lots of available tables. The best of the four was a popular chain steak house concept. Let's try to put ourselves in the shoes of management.
Last year, our example steak house had annual covers of 50,000 and sales of $2,000,000. Covers in the current month are off 30% vs. the same month last year. The current average sales per cover is $40 and management is studying options.
One manager favors a 5% across the board cut in menu prices. The hope is to keep the drop in covers at 20% vs. last year. Sales would drop to $1,520,000 and the food cost % would increase 1.84% (to 36.84% up from 35%). Labor expenses and other operating expenses are forecasted to hold at the current cost per cover.
The general manager sees danger in the drop and favors holding menu prices at the current levels.
So who has the better plan?
Across the board menu price cuts are always risky. As covers decline, we would also see a drop in the contribution per cover. This is a very difficult plan to manage.
I prefer the GM's solution. No menu reprint is required and there are plenty of tactical options available. Selective price drops may be implemented using specials to promote entrees using lower cost seasonal ingredients. Specific days of the week could be targeted for selective price cuts. As long as the covers on busy nights and busy seasons stay close to plan, the strategy will succeed.
In our example, the GM's solution would produce a higher profit despite a steeper drop in covers. A 5% cut in sales per cover would not produce a bigger profit despite 5,000 more covers. The drop in sales per cover of $2 is not a simple to implement strategy. All income statement accounts would feel the impact. Waitstaff would see their tips per cover decline. Careful study is needed to predict the impact on your operation.
Monday, September 25, 2006
High Degree of Operating Leverage
Some of my earliest clients were high volume restaurants on the New Jersey Shore. I noticed some key similarities among the successful operators. The very best started with a small operation on a relatively large area of land. Over time, they grew the restaurant's capacity with incremental additions. At their peak, these restaurants had many dining rooms and multiple kitchens. Some were found in the annual top 100 lists in industry publications.
As I gained clients further north in the state, I advised them to try growing incrementally and talked some out of major unit expansion. Rather than enlarging the fixed cost base, I advised them to maximize their profit at existing locations.
Since food service operations exist in a highly competitive environment, operating margins tend to be low. A restaurant operating at or near their break-even point will have a high degree of operating leverage. Any increase in sales volume beyond break-even will produce a significant increase in the bottom line. This leverage will decline as sales volumes increase over time.
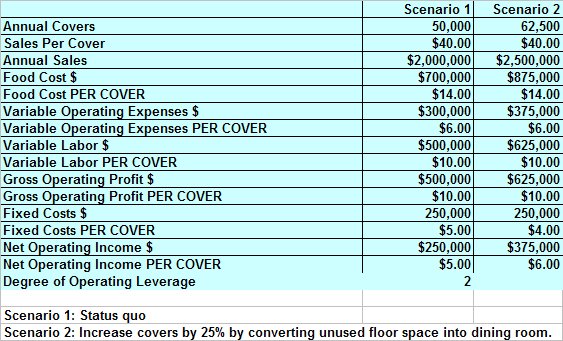
To illustrate the concept of degree of operating leverage, let's look at an example of a steak house concept doing 50,000 covers per year and an average sales per cover of $40. Their 35% food cost translates to $14 per cover, their variable labor is $10 per cover and direct operating expenses are $6 per cover. Fixed costs total $250,000. The degree of operating leverage at this point in time will equal 2. A 25% increase in sales will produce a 50% increase in profits.
Rather than opening a new unit 20 miles away, the operators convert unused floor space into an additional dining room. The new seats fill quickly on busy nights and the room is closed early in the week. Covers increase by 25% to 62,500. If all costs remain in line, profit will expand by 50% from $250,000 to $375,000.

One of my clients expanded the dining area in the original restaurant three times before successfully opening a second location. The steady cash flow from the original site allowed him to take a bold move and he now has two high volume operations.
As I gained clients further north in the state, I advised them to try growing incrementally and talked some out of major unit expansion. Rather than enlarging the fixed cost base, I advised them to maximize their profit at existing locations.
Since food service operations exist in a highly competitive environment, operating margins tend to be low. A restaurant operating at or near their break-even point will have a high degree of operating leverage. Any increase in sales volume beyond break-even will produce a significant increase in the bottom line. This leverage will decline as sales volumes increase over time.
To illustrate the concept of degree of operating leverage, let's look at an example of a steak house concept doing 50,000 covers per year and an average sales per cover of $40. Their 35% food cost translates to $14 per cover, their variable labor is $10 per cover and direct operating expenses are $6 per cover. Fixed costs total $250,000. The degree of operating leverage at this point in time will equal 2. A 25% increase in sales will produce a 50% increase in profits.
Rather than opening a new unit 20 miles away, the operators convert unused floor space into an additional dining room. The new seats fill quickly on busy nights and the room is closed early in the week. Covers increase by 25% to 62,500. If all costs remain in line, profit will expand by 50% from $250,000 to $375,000.
One of my clients expanded the dining area in the original restaurant three times before successfully opening a second location. The steady cash flow from the original site allowed him to take a bold move and he now has two high volume operations.
Wednesday, September 20, 2006
Entree Pricing-Dollars vs. Percentages
The adage says "We put dollars in the bank NOT percentages." So, should you run some higher priced entrees with a corresponding higher food cost percentage to boost profits? Maybe. You should be prepared for some unplanned possibilities.
I'm going to use an example steak house with current annual covers of 50,000 and sales of $2,000,000. The average sales per cover is $40. Management has decided to introduce two new entrees priced $10 above the current average entree price. These entrees are costlier and will raise the food cost percentage.
Let's say 20% of patrons choose the new entrees and covers remain stable. Sales increase $100,000 and food costs go up $50,000. We should have another $50,000 going in the bank account. It's a good thing...right? Maybe.
All too often, managers forget to follow through with the dollars vs. percentages concept in the other cost components. If they track labor cost and other operating expenses on a percentage basis, a big chunk of the $50,000 could leave the bank even though operating reports look solid (percentage viewpoint). These cost components are fairly difficult to manage on an entree basis. Few companies track utilities on a per cover basis.
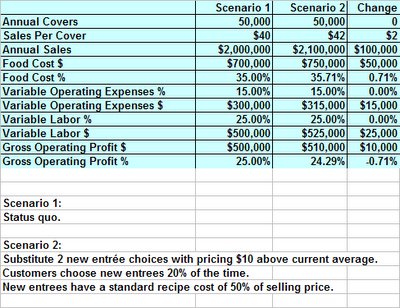
If we had variable labor costs of 25% and other operating expenses of 15%, you could see $40,000 (40% of $100,000) in higher labor and operating expenses creep into the income statement over time. We'd still be $10,000 ahead of the status quo.
If the raw ingredients used to prepare the pricier entrees are more volatile in price, you could actually see months with zero change in the bottom line despite a nice sales jump. How often do you read articles about publicly traded restaurant companies with higher check averages and average unit volumes with little to show on the bottom line? Management explains the disappointing profits are due to higher prices for key entree items. It happens all the time.
I'm all for more dollars in the bank. Don't ignore percentages when implementing these strategies.
I'm going to use an example steak house with current annual covers of 50,000 and sales of $2,000,000. The average sales per cover is $40. Management has decided to introduce two new entrees priced $10 above the current average entree price. These entrees are costlier and will raise the food cost percentage.
Let's say 20% of patrons choose the new entrees and covers remain stable. Sales increase $100,000 and food costs go up $50,000. We should have another $50,000 going in the bank account. It's a good thing...right? Maybe.
All too often, managers forget to follow through with the dollars vs. percentages concept in the other cost components. If they track labor cost and other operating expenses on a percentage basis, a big chunk of the $50,000 could leave the bank even though operating reports look solid (percentage viewpoint). These cost components are fairly difficult to manage on an entree basis. Few companies track utilities on a per cover basis.
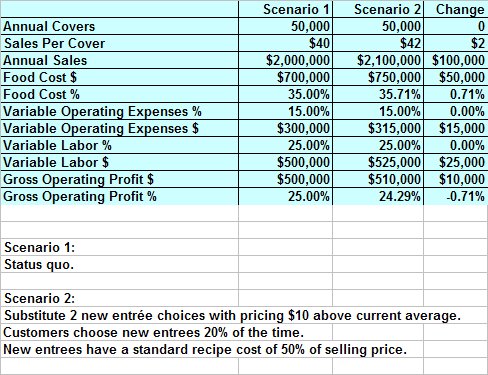
If we had variable labor costs of 25% and other operating expenses of 15%, you could see $40,000 (40% of $100,000) in higher labor and operating expenses creep into the income statement over time. We'd still be $10,000 ahead of the status quo.
If the raw ingredients used to prepare the pricier entrees are more volatile in price, you could actually see months with zero change in the bottom line despite a nice sales jump. How often do you read articles about publicly traded restaurant companies with higher check averages and average unit volumes with little to show on the bottom line? Management explains the disappointing profits are due to higher prices for key entree items. It happens all the time.
I'm all for more dollars in the bank. Don't ignore percentages when implementing these strategies.
Thursday, September 14, 2006
Ideal Usage Tricks and Techniques
The people who produce variance reports for the weekly and monthly management meetings need to forecast the likely meeting discussion for each red flag item. Common excuses occur over and over and it's necessary to anticipate and eliminate these distractions. The only way for a food and beverage professional to have a positive impact on the results is through proper focus.
Find the real problems ahead of time and structure your handouts (or overhead presentation)to highlight the major issues. Everything else is simply an exercise in excusing poor results. When the acceptance of these anecdotal responses is chronic, the operation will lose control and wide fluctuations in monthly numbers will ensue. Hopefully, a review of the common excuses will help you prepare for the next meeting and the tide will turn.
At the very top of my list is the inaccurate inventory extension. Since you should have complete control over this number, avoid making bad numbers "the reason" and take the extra time to double check all very small and very large extended values. There shouldn't be any spice, flour, pasta or rice valued in the thousands of dollars. Lobster tails shouldn't be valued for pennies. Make a second copy of your Excel file and sort the list in both ascending and descending order. See what comes to the top and ask if it makes sense.

Cutoff issues are always near the top of the list and the actual inventory count should be taken without deliveries. Check your drawers thoroughly and look under the desk for missing invoices. If you keep a receiving log (highly recommended), use the log to make sure you have every delivery included in the proper accounting period. Check with accounts payable for a copy of the latest statement and see if the credits are reported in the proper period. Try to completely eliminate accounting adjustments from the management meeting discussions. It is a distraction and credibility quickly disappears when the numbers don't follow the matching principle.
The operators will have front line experiences which should be the real focus of the meeting and it's important to be prepared to support these topics. Let's say you have a major unfavorable usage number for beef tenderloin. Do your own investigation on customer returns and possible menu specials(POS system data). Check waste reports if you maintain these records. Subtract the waste from the total variance to determine the net amount (variance NOT explained by waste). Try to get to the heart of the variance. There will always be steaks returned by customers due to miscommunication of their cooking preference. Excessive waste and customer returns must be documented and the problems must be solved fast.
Production staff will give better explanations if the topic is presented in a straight forward manner. Imagine the meeting dynamics. It's possible for certain issues to be assigned too much weight. If the waste and returns are minor, report the total variance and show a separate line for the waste and returns. Calculate the net variance and open the discussion with this figure. You may find the real problem involves meat which did not meet specification. Portion control may be lax. There is always a risk of theft. Listen for other explanations and you'll get closer to the true variance issue.
Before your meetings, go back to your recipe model and look for recipes which call the top variance items. Follow the recipe path backwards if there is butchering or trimming involved. Ask yourself if the actual usage is a better figure than the ideal usage. My tenderloin example was chosen specifically for this angle. An untrimmed tenderloin will lose close to 50% of it's weight when being prepared for steaks. If you don't have a butcher yield sheet for the item, print one for the meeting and make it an action plan item.
Once you are in the meeting, get the variance analysis focused by introducing each item thoroughly before the discussion begins. Your credibility will increase as you move beyond traditional distractions involving inaccurate extensions and cutoff problems. Supply everyone with your preliminary analysis and highlight the net variance. As the management team begins to take you seriously, they will come better prepared and some genuine progress will be the result.
Thursday, September 07, 2006
Food Storage Rules
There are certain items which must be stored more carefully in order to hit your cost targets. Highly perishable items are the top priority. With most vendors running daily deliveries (despite rising gas prices), the quantity of highly perishable goods should be minimized. Schedule the purchases carefully and avoid excessive buys. Spoilage of highly perishable items should be kept to an absolute minimum. Make sure the coolers are well organized and always rotate stock after a delivery.
Store items with a high risk of theft in very visible locations. Too often, I see small, high cost portions of premium meats and seafood left in storage areas far from management's view. Certain operations stock 5 ounce tenderloin portions and jumbo shrimp in storage areas well away from the office. It's much better to move these items close to your field of vision.
If you like video surveillance systems, make sure one of the cameras is pointed at the location used to store high risk items. If you use pull sheets, keep the sheets for these coolers in your office and in plain view. You should know how many portions are available for sale to customers at the start of each shift. On a rotation basis, you should subtract the meal period POS menu item counts from the opening quantity and check the inventory. At a minimum, count these high risk items daily.
Make your freezers easy to count. Keep everything in the exact same location at all times. Messy freezers are a problem which should be solved ASAP. If items are improperly stored in the frigid environment, it's very likely you will order more when they are in stock. Once the staff see the new delivery, theft is easier and unlikely to be detected.
Walkin coolers should follow the same rules as the freezer. If you need some space for rotation of special items, try to set aside a separate cooler or a defined section of your larger cooler. Most items should be stored in the exact same location at all times. Orderly freezers and coolers make ordering more efficient and help prevent unwanted losses due to theft and spoilage.
Finally, dry storage areas are typically the best maintained of all inventory locations. Make sure super expensive items like saffron and truffle oil is in a place where theft is completely impossible. Keep the storage rooms dry and cool and watch expiration dates. Try to reorder dry items using a par stock system. Determining par levels may be difficult for event caterers but most operations should find two or three par levels sufficient. For busy periods, build the stock to the high par level. Drop the par when business is slow. Maintain the status quo at other times.
Click Here For More Information
Tuesday, August 29, 2006
Leave Labor Out Of Inventory
From time to time, my clients ask about the practice of including labor expenses in work in process inventory valuation. I am against this practice due to needless complexity. Those who decide to change their inventory policy always see a one period bump. However, in the long run, the impact of this policy change will be low.
The key issue in the decision is the perishable nature of food (both as purchased and prepped). Most food inventories run about 14 days of cost of sales or less. Within the total inventory value, at least 75% is typically stored as purchased. One fourth (about one half week) may be in the prep box. Adding another 20% to the value of the WIP items to account for labor cost will reduce cost of goods sold about 2.5% in month one (see calculation below).
Once you hit month two, the inventory change will be minimal. Now you have locked yourself into a needless monthly exercise. It is far more conservative to completely expense all labor in the month the hours were spent. Even seasonal operations should see very little benefit with adding labor to WIP.
The key to inventory valuation in our industry is proper tracking yields on the work in process items. A steak should be valued at a greater price per pound than the large cut of meat butchered to produce the steak. Divide the as purchased price per pound by the yield percentage. Go the extra step of adding a separate line item on your inventory sheets. Let the counters weigh the large untouched cuts and keep a separate count of the trimmed portions.
If you carefully track the entire butchering and prep process for yields, you will create enough data to properly determine standards for ideal usage calculations. Many operators fail to evaluate a large enough data set when creating these standards. Comparing week to week variances from solid standard yields will explain most of the differences in your food cost. Theft and spoilage is far more difficult to quantify. Employees rarely document waste and theft each period.
Calculation: (3.5 divided by 28) times 20% equals 2.5%.
Click Here For More Information
Wednesday, August 16, 2006
Navigating Through The Recipe Jungle
From time to time, certain issues surface when recipe standards are effected by seasonal shifts. The common high impact issue concerns produce yield and price as seasons change. For example, the Romaine lettuce you purchase in the off season may not only cost more. The yield will be far less than peak season. Often you will see a case price double and the yield decline.
These times of high priced, low yield purchases should trigger a menu shift. In winter, I'd recommend as the special each night a wonderful soup made from seasonal root vegetables. Steer the customers away from the popular Caesar Salad to Minestrone.
At this time, we in the Northeastern USA will see prices plummet on beautiful peppers. Menu items with roasted peppers, stuffed peppers and sauteed peppers will fully utilize the high yield, low price cases. On the other hand, this may be the absolute worst time of year to buy apples. With a few weeks to go until the apple harvest begins, current offerings are often of poor quality and from 50% to 70% above prices you can expect to pay in one month.
If your menu is inflexible and some highly popular items must be produced from ingredients which are out of season, create a completely new recipe calling the
poor yield item at the inflated price. Save your main recipe for the peak season.
Now when your food cost percentage trends upward, you'll be able to quantify the impact of the limitation in your menu.
Click Here For More Information
Saturday, August 12, 2006
The Recipes Are Wrong!
Variance reports frequently identify huge differences between actual item usage and the calculated ideal usage. There are many reasons for these major red flags. To eliminate the obvious, you need to review the fundamental calculation of actual usage. Recheck your counts from the two inventories. Go over the invoices for the period. Check for very small and very large quantities. Make sure you did not miss an entire invoice. Pay strict attention to invoices near a cutoff date. Anything received after the ending inventory should be excluded.
Once you have adjusted your actual usage to reflect changes, take a second look at the variance. You need to switch your focus to the recipe model. If an item is butchered, trimmed, cleaned, processed or if the item increases in volume when cooked (e.g. rice, pasta, etc.), you need to check your standard yields. Make sure you haven't entered the reciprocal figure in a subrecipe yield.
The final check is in plate recipes and portion sizes. These quantities should be exact and at this phase allowances for tiny variation should be avoided. Your plate recipe model should not be soft. You need exact portion sizes to tie to POS counts.
Whenever possible, line cooks should use pre-portioned items in the final production.
If you finish your review and find the inventories were accurate, purchases were all in order and the recipe model is accurate, you have an operational problem. There are certain problems which persist in our industry.
Employee consumption of food and beverage items has a bigger impact in slow periods. During the off-season or slow days of the week, employee meal cost will be higher as a percentage of sales. Adjust your expectations to this reality and move on to much greater concerns.
Collusion with vendor delivery staff is the first possible problem. You need to only pay for food actually received. Make sure receiving controls are rock solid. Limit your testing to invoices with large variance items. Problems may occur on certain shifts or on a specific day of the week. Check each invoice for the delivery person and your receiving person. Look for patterns.
Chronic, unintentional food overuse needs to be identified and halted. Training will correct future overuse. Portions of salads, starches (including french fries), garnishes, soups, sauces and all other discretionary prep items need to be clear. If the operation uses forecasts to prepare for a busy period and perishable items need to be discarded, fill out waste sheets and record the reason as bad forecast.
Your storage areas should be easy to count and high cost items should be difficult to steal. Small portions of tenderloin, shrimp, lobster tails and crab may require additional controls. Pull sheets are helpful. Sheets should be completed with initials and checked by the manager each shift change.
Late night and early morning are the times of greatest probability of theft. Delivery times are just as bad as the close. If you have surveillance systems in place, these periods should be highly scrutinized. We have found brazen thieves taking full cases of food to the dumpsters, trunks of their car, etc. It's best to terminate these people at once.
When I first started my consulting practice, there were two excellent articles on theft. The Wall Street Journal had a survey conducted by F.W. Dodge in which they interviewed food service employees. Of the respondents, 44% admitted to theft. I went to see if there was any other sources on employee theft. I found a general psychology article (source unknown) which stated about 20% of workers are very honest and 20% of workers are very dishonest. The middle 60% tend to follow the herd. If they are working with a completely honest person, theft is minimal. However, when they work with thieves, they will often steal to the same extent as their dishonest co-worker.
Over the years, I have seen major mistakes made by honest workers. One person left spare ribs unattended on a grill to check a delivery and they were inedible. Another person decided to pre-cook a huge number of rotisserie chickens for a special promotion on a low traffic day. In both cases, the employees made mistakes which were one time events. Both of my clients said nothing to the employees. They both realized their mistakes and brought them to management's attention in the first place. Keeping records on simple waste sheets encourages this honest loss activity to be quantified and archived for future period comparisons.
It's difficult for me to leave the theft issue hanging and management often can't see how major theft is possible. However, over the years we have found managers with relatives in the pizza business filling a van with flour, cheese and canned tomatoes. A multi-unit chain in New York tracked a vendor delivery person who visited five of their stores trying to sell cases of shrimp as a "cash only" special. Someone lost the shrimp due to poor receiving controls. My first consulting client ever couldn't believe the long time chef was a thief until the employee admitted he stole two blocks of 16-20 shrimp a week.
If you believe you have reviewed and corrected all the items mentioned above and your variances still don't make sense. Review the POS setup for all menu items which call for the variance item. Look for specials, the OPEN FOOD key and buffets. You may even find the item is wrong in the system. Some companies allow managers to overwrite the menu item names on the POS. I'm not a fan of this method. The entire history is ruined with one small change.
If the operation has no issues at all, check the recipe. Maybe it really isn't correct. Sometimes the wizards make mistakes.
Friday, August 04, 2006
100% Cost Percentage?
As I entered the professionally designed coffee shop on Madison and 49th Street, my first observation was the herd of Wall Street types sipping espresso. The grand opening was in full swing. The press had done a fantastic job of getting the word out. Sales were brisk and it was difficult for my clients to hide their emotions.
As the jubilation of the busy opening faded, the reports began to show a huge cost problem in the premium bottled drinks category. These refrigerated products were available on a help yourself basis. The general manager and the vice president asked me: "Is it possible to run a 100% cost of sales?" My answer was a simple yes. They looked at me incredulously and demanded to know how items priced to yield a 30% cost of sales could possibly have a 100% figure. My answer was "Massive theft!" They agreed there might be a bottle or two taken every day by "customers" but there's no way theft could explain this level of variance.
We continued to debate the theft issue and I explained the true yield was 100% which would rule out portion issues. The items were all shelf stable which would rule out spoilage. Breakage was possible but they explained the new store had yet to suffer a broken bottle incident. So where do we find the 70% variance? I held my ground with the massive theft theory.
The offices were upstairs and we took the elevator to continue our meeting away from the operation. During our meeting I asked for the complete path a bottle would take from delivery to sale. The deliveries were approved by the morning manager and full cases were stored in a first floor storeroom near the sandwich production area. Bottles were restocked three times a day by general helpers (morning, pre-lunch and post-lunch). As our meeting broke up, I asked to visit the first floor storage area to check for locks and other security features.
As we entered the sandwich area, I noticed the four prep workers were all drinking premium bottled beverages. I asked them how they account for employee beverage consumption. The general manager told me they were allowed unlimited coffee and fountain drinks. I asked for clarification on the premium bottled beverages. The answer was the employees would have to pay for these drinks.
Indeed we found the extra 70% cost. The specialty iced teas in assorted flavors were the most popular drinks for the workers in the hot production areas. The opening was in July and the weather was sweltering and the prep area had no air conditioning unit. These workers were drinking these bottles by the case while the paying customers out front barely noticed the premium drinks cooler. Everyone was drinking barista specialties.
For those who want to know how the cost percentage could be 100%: Take a $0.45 bottle and sell 3 at $1.50 each. That's $4.50 in sales. Now subtract 7 bottles due to employee thirst. That's 10 bottles (3 sold plus 7 unsold) at $0.45 or the very same $4.50.
Monday, July 31, 2006
Reuse Paper Clips
Energy prices have a significant impact on the economy. High gas prices are like a tax on the citizens each tank. Budgets need to allow for high gas prices and their impact on our industry.
In the mid-1980s, the price of a barrel of oil plunged to $5. Our clientele were put under enormous cost constraints as construction and oil exploration came to a halt. The chief operating officer in our company made a tour of the globe carrying copies of an internal memo from the largest industrial contractor. The short memo stressed cost containment at all levels and made many specific instructions including the reuse of paper clips.
We immediately changed our corporate travel and entertainment policy, created a request system for office supplies and called all contractors to renegotiate service levels. Our clients requested meetings with our contract team and we worked on change orders which guaranteed coverage of fixed costs and reduced the number of onsite managers required by contract.
Our parent company was moving away from a reliance on remote site feeding through acquisition. We started looking for acquisition targets with contracts in urban areas. During this period, I studied zero based budgeting and constructed decision packages for each department and for each acquisition target.
We were able to grow sales and profits by milking the remote site feeding cash cow and investing in less volatile urban companies.
Today, the level of activity in oil exploration is back near the peak and the Edmonton Oilers were in the 2006 Stanley Cup series. I heard a Fort McMurray Today broadcast on public radio and the person being interviewed mentioned a mean salary of $90,000 for the city. I'm sure there are articles about Edmonton's population doubling in the next five years as there were back in 1982.
Back in 1975, my college friends and I went on spring break to Florida. We needed to sit all night in Savannah to get gas since the stations had no gas until the morning delivery. It took about ten years to go from the gas embargoes to the huge drop in oil prices. During this period, oil production began on Prudhoe Bay, Colorado oil shale mines were developed in Parachute, major offshore drilling took place in Alaska, Scotland, Norway and Newfoundland.
The current run in oil prices began during the final year of the Clinton presidency and has now entered the seventh year. In 1982, there were predictions of $100 per barrel oil (vs. $35) and today we hear many dire predictions. Meantime, China is developing strict policies on energy use and America is promoting ethanol usage. Hopefully, in three more years (or less) we'll have more memos floating around demanding reuse of paper clips at the major construction companies.
Thursday, July 27, 2006
Sources For Competitor Analysis
In the recent quarters, I have studied 10Q reports for several steak house concepts and all of the companies reported store openings and closings in these reports. In addition to the excellent public reports available on www.sec.gov, there is a wealth of competitor analysis available on the web. I use the excellent information available online at Restaurant Chains and their excellent email Alerts.
An objective plan should contain a thorough competitor analysis with the expected impact on current units and expected openings. It's possible to get a vivid picture of the year ahead through public reports, online searches and press releases. Data on openings is always available months ahead of time. Local newspapers and magazines frequently announce new projects.
These publications also cover closings. A prudent planner would be wise to build in some closings in a realistic five year plan. Just look at Zagat's annual memoriam page in each city, you'll find plenty of closings.
Carefully select your targets for new units. Provide for real world disappointments in your numbers. Check out reports on public companies and look for the term discontinued operations. Careful competitor analysis and realistic planning will provide an achievable long range target.
Thursday, July 20, 2006
Market Segmentation - Strategic Focus
In a previous post, Market Segmentation - Best Practices , I reviewed the best practices from seven segments. Each of these segments has a different strategic focus and the differences impact their long range plans.
Hotels
Hotels plan for occupancy levels, REVPAR, banquet event orders and conventions. These operators forecast sales and expenses by departments. In a smaller property, there may be a single kitchen with one or two bars and several banquet rooms. Larger properties have multiple kitchens and many concepts. These huge hotels and resorts often book very large events. They typically have a flexible floor plan for the affairs and book many events simultaneously.
The food and beverage team takes a critical view at each meal period, event, buffet and room service. Plans include departmental level figures for food and beverage revenue, production labor, service labor, banquet labor, bar labor, etc. In addition, all other operating expenses are budgeted by department. Monthly reports compare the actual results to these budget numbers for each operation.
Restaurants
The restaurant wizards take a look at previous year's statistics and focus on covers per meal period, check averages, turns, menu price increases, raw ingredient fluctuations and waitstaff productivity. They use this data to forecast the year ahead. Plans consider old competitors as well as fresh concepts in the market. Pricing strategy depends on profit targets and competitive pressures.
From the comparison of menu prices before and after a factor may be applied to the check averages. Covers per period, turns and any change in the number of seats provide the volume data. For each meal period, a sales forecast is put together using the estimated check averages and the forecast of covers. These figures are summarized by week, month and quarter and become the focus of the budget.
Clubs
Clubs analyze a la carte menus much like a restaurant with a large percentage of sales from regulars. They analyze similar meal period and check average data. Often, banquets and buffets represent a higher percentage of sales than a restaurant. The banquets and buffets are forecasted from a study of previous year's data (often more than one year is examined). Operators forecast start dates and end dates for seasonal clubs and weather may help or hurt them in attaining budget goals.
Provision for staffing is required for the main season and the off-season. Food and beverage revenue and expenses is put in perspective with the members goals. Some clubs seek a break even result from F&B and others expect a small loss. The best F&B operations at major clubs make a positive contribution.
Institutional Caterers
Onsite feeders run a decaying operation along side a growing operation. Since most contracts have a definite termination date, management takes a looks at contract due to expire in the year ahead. Some contracts end when a construction project is completed. If the contract will be renewed in a competitive bid, a probability of success is assigned to the project. Knowledge of the competititor's contract expirations is also critical. Similarly, an estimated probability of taking over each account from the competition is calculated.
The marketing department provides details on new business targets and their estimated probability of success. Each project is defined as hard dollar (profit or loss depends on actual results) or cost plus (all expenses paid plus a fee for management). Total volume affects the amount of overhead required. Cost plus jobs are less risky at the operational level but the documentation of job costs is higher than a hard dollar account.
Institutional caterers break down costs into many categories since the projected margins are slim in relation to revenue. The return on equity is typically much higher than a hotel or restaurant since these operators invest very little in the bricks and mortar.
Markets
The markets I have worked with treat the prepared food section like a restaurant although the top managers use market terminology (for example shrinkage includes normal trim in many markets). Projections are made for each menu category with salad bar, roasters, sandwiches, pizza, prepared entrees, sushi, hot buffets, and bakery fairly typical of a large market. Some markets now allow guests to sit down and consume the meal on the premise and alcoholic beverages may be possible. Service is typically self-serve with trays.
The long term plans reflect the size and scope of the operation. Larger markets prepare figures similar to a food court with a single owner. Projections are calculated for each category but the entire operation usually has only one kitchen with a production staff capable of preparing any food item.
Event Caterers
Banquet event order systems house data banks for the previous year and the events already booked for the future year. Event caterers look at each month or season and visualize the year ahead. If the system has too few events in a normally busy month, they will put more sales and promotion assets to work. Letting a night go dark in a busy period is something they want to avoid.
Focusing on each event as a separate job allows a complex budgeted income statement for all events. These estimates are placed side-by side with the actual figures as the year proceeds. Many event caterers segregate purchases by event. Careful control is exercised over each detail.
Alcohol may be served in a cash bar or open bar format. This is determined for each event and estimates for the bar charge need to be made if the agreement is for a fixed beverage cost per patron.
Race Tracks
Race tracks are large complexes with lots of space for guests to roam and many ways to offer food and beverage. Most tracks offer one or more formal dining areas with wait service. Buffets are offered in many tracks since customers are in a hurry to return to the action. Throughout the entire complex, numerous bars and food outlets serve a variety of menu items in a QSR type environment.
Each kiosk is tracked separately and forecasts are required for these stands. The person in charge of the stand prepares a sheet and accounts for the beginning inventory minus ending inventory with a cash projection and reasons for shortages.
Long range plans account for the projected losses due to theft and poor forecasts. Operators try to limit these losses.
Overview
The long range plans must account for marketing costs, leasehold improvements amortization, rents, mortgage expenses, equipment rentals, depreciation, fleet maintenance, etc. At the heart of each operation, the food and beverage team need to accurately forecast demand. This demand may take the form of special events, rooms occupied, nightly covers, hot dogs per stand times the stand count, REVPAR F&B component, contracts retained, etc. The secret to success in each highly specialized segment is knowing the marketplace. Customer knowledge, competitor intelligence, major events and the weather may have a major impact on the operation from year to year.
Tuesday, July 18, 2006
Planning For The Unexpected
Today, I witnessed a 1 in 10,000 event. I went to my local barber for a haircut and the place was empty when I arrived. Shortly after I sat in the chair, a young man with red hair entered and sat down in a seat near the door. Just before my haircut was completed, a mother arrived with twin red heads and they were dispatched to two other chairs.
Since I am also a natural red head (now faded to strawberry blond), the four of us were the only clients at 2:30 PM. I've been told the probability of being a redhead in the USA is approximately 10%. Taking .1 to the 4th power, you have a 1 in 10,000 event. Four redheads being the only clients at a single time is rare.
You should always carry adequate insurance protection and budget the cost in your five year plans. Unusual events do occur.
Click Here For More Information
Saturday, July 15, 2006
Beyond Inertia
In my experience, food cost behaves differently than the physical objects subject to inertia. A tightly controlled food cost stays in line through the efforts of "an outside force" (management). If the outside force is eliminated, the tight food cost will disappear as well.
An out of control food cost will tend to become a greater problem unless an intervention takes place. Leaving a problem alone will not maintain the status quo.
Management by exception provides a system for isolating sub-par performance and devoting resources to turn the situation around. Going back to the physics idea, the larger the unit in question, the greater the problem and the need for a solution.
It is wise to plan for the resources needed to troubleshoot problems in major operating units. Should you divert these resources to smaller issues at smaller units? Probably not a good idea.
Often the time and resources devoted to minor issues in an organization is disproportionate to the potential benefit. People talk of "the squeaky wheel" and often management by exception focuses too much attention on the smaller wheels.
Try to work on solving big issues first before you tackle minor problems.
This logic may be extended to single unit operations. In the high volume, single unit operation you'd be wise to focus on problems affecting major activities. Try to put the little annoyances in perspective.
You may find 80% of your efforts are spent on activities which can only capture 20% of the potential improvement. This is par in most organizations.
Design your reports to highlight major variances and provide comparisons and summaries which put all variances in proper perspective.
Click Here For More Information
Thursday, July 13, 2006
Planning For Competitive Threats
Any respectable five year plan needs to take a hard look at both the known competitive threats and the possible threats which are not yet obvious. You should start with your main competition. Analyze their current strategies and estimate the impact on revenues in year one. Try to anticipate the outcome and develop a strategic plan for counter-attack.
Porter's five competitive forces is an excellent tool for analyzing competitive forces.
Porter's five competitive forces is an excellent tool for analyzing competitive forces.
Saturday, July 08, 2006
Passion For Long Term Planning
During my corporate life, the chief operating officer for our group was a frequent flyer with a huge territory. He would schedule meetings roughly twice a year although an unannounced visit was possible at any time. One topic was front page in every scheduled visit. Long range planning was his passion. He viewed the company as a "confederacy of entrepreneurs" and encouraged all of his direct reports to view their plans as a contract.
This passion was best manifested in his favorite story. I will do my best to paraphrase his short tale:
"Every one needs to be a good planner. Sometimes managers forget to plan. These managers may lose sight of their vision.
Planning isn't just for managers. Every person in the organization should have a plan. The time period we need to plan for is a function of our position in the company.
A good pot washer has a plan of attack. He needs to organize the pots and pans and setup a sequence of tasks to accomplish his mission. The tasks might include preliminary rinsing, separation of pots which require soaking and scrubbing, washing the easy pots first and then finishing the tough ones after they have soaked.
This pot washer will be much more productive than one who takes one pot at a time and deals with it.
I expect the top managers to have a much longer time horizon than one meal period. We need to forecast years in advance and have a plan to grow. This plan should keep competitive threats in mind. The plan should focus on the discovery of profitable opportunities.
We use five year plans to provide a compass for the future. Our annual budgets provide us with a means of tracking the plan and making changes over time."
We worked on a new five year plan every year. Our budgets were always based on the year 1 numbers from the most recent plan. The budgets of future years would always take into consideration the most recent year's actual results and the original expectations from the five year plan.
These plans were used to evaluate results monthly, quarterly, semi-annually and at year end. A significant portion of executive compensation was tied to performance.
Thursday, July 06, 2006
Why Should You Count Key Items Daily?
If you have ever taken a shot at linking your entire POS item listing to recipes, the effort is significant and hopefully the return will match. The typical recipe model will include a lot of educated guesswork. Perhaps 5% subtracted from the perfect yield to allow for normal variance. When guessing the count for a typical box of 16-20 shrimp, most people use the low number - 16. If it's actually 20, that's a 20% difference.
Dry goods may settle and when called in recipes by volume, yields can be less than expected. Some models adjust to the conservative side. People want variances to be caused by actions or activities other than normal yield variation. Most people set standard yields to the low side of normal.
Let's introduce a brazen thief into the formula. Our thief is taking a case of frozen meat to the garbage bin about 20 minutes before closing each night.
In our example, it's a high volume operation and the menu is dominated with ribs. Half racks and full racks are sold with a variety of sides and combo choices. The ideal usage calls for 100 cases of ribs a week. The thief works 4 nights a week.
Would your recipe model catch the 4% variance due to theft?
Portion control helps. A case of 30# baby back ribs will include 24-1.25# racks. Daily counts of prep, preliminary cooking and POS sales will help answer the 4% riddle. You won't have time to do this analysis with each ingredient.
Pick your top 10 to start. It can get addictive when you see the savings. I'd limit this daily activity to 25 items.
Click Here For More Information
Thursday, June 29, 2006
Sampling Techniques
Since I received a couple of emails regarding the sampling post, I'd like to mention an auditor's portal caled "AuditNet" and the publisher John Wiley. The AuditNet site has a link to an Excel file which calculates sample sizes for a variety of techniques. John Wiley publishers were the go to company when I studied sampling theory. I browsed Amazon and they have the classics (in used condition) as well as some newer books.
Click Here For More Information
Click Here For More Information
Monday, June 26, 2006
Ideal Usage Calculation-Major Hurdles
Any top 10 list of ideal food usage problems should include the open food key on your POS system. Take a look at your product mix report and find open food as a percentage of food sales. A worst case scenario involves over 10% of food sales attributed to open food. Less than one half of one percent is a good target. Your operation probably runs somewhere between these extremes. The higher the open food sales as a percent of total food, the lower your chance of success in calculating an accurate ideal usage.
Large buffet sales may hamper ideal food cost calculation. This is not the case in all operations. Many chefs are fantastic with buffet control. I've seen higher variances in operations with a high buffet sales component. Buffet recipes are tricky and many operators give up on developing a complex recipe model.
Menu item explosion can implode the ideal usage calculation. The more items on the menu, the lower the chance of accurate food cost prediction. Focused menus with very few specials represent your best option. When it is impossible to offer a menu with a tight focus, try to view your menu in logical sections. These sections should focus on a particular food category (e.g. steaks, seafood, etc.). Some sections will be more kind to the recipe team. Calculate a separate ideal usage percentage for each section.
In general, the greater the yield variance in producing an entree portion the lower the probability of accurate ideal usage calculation. Try a simple exercise. Take 90 days of purchase history on any large meat cut used to produce a popular menu item. Simply enter the weights per piece in a column of a spreadsheet. Calculate the average weight per piece and the standard deviation. As the standard deviation expressed as a percentage of the average weight increases, your chance of accurate standard recipe creation declines. Consider portion control items whenever you experience huge variances in usage on entrees cut from large meat cuts.
If you develop each day's menu in the morning at the market, your chance of accurately predicting ideal usage may be zero. I have never seen a market driven menu with a tight difference between actual and ideal. The higher the percentage of sales generated by specials, the lower your chance in consistently hitting an ideal number. Production and prep activities will be closely tied to your purchases. Actual sales may differ widely.
Low sales volume will hinder any attempt at ideal usage calculation. Combined with an unwieldy menu, low sales volume can spell disaster. When the sales are extremely low, all efforts to control costs should take a lower priority. Your menu strategy is failing and the market has spoken. Try a smaller, easier to produce menu and get the word out in the press. Offer some promotions and solicit customer criticism. Go with the winners and cut all the menu dogs.
Consistent food cost results are a function of logical menu mix, tight menu focus, excellent POS menu setup, limited specials and buffets, predictable portion yields and a profitable sales volume. If your attempts at ideal usage calculation have been disappointing in the past, examine your operation and eliminate the obstacles to success. Find the ingredients which are always in the top variance list. Make an easier to track production method for these problem items. Better results happen one ingredient at a time.
Click Here For More Information
Tuesday, June 20, 2006
Perpetual Inventory-Stratified Random Sampling
My final review with the RCA Corporate Audit staff involved the Accounts Receivable sub-ledger at the global telecommunications subsidiary. By the time I was asked to help, the job was already over the budgeted time and everyone was under the gun to get the report to management. To keep costs at a minimum, I requested interns from Rutgers Graduate School of Business.
During training conducted by the Arthur Young CPA firm, I became the statistical sampling "expert" when I corrected the instructor on the final day. Arthur Young had an excellent sampling tool and I asked my boss if we could try stratified random sampling to help with the project deadline.
Basically, a stratified sample focuses more attention on higher impact accounts (in this case customer records). We examined the printout of sample selections and found we were to examine the top 5 customers and a representative sample from each of the other strata. I won't discuss our results but I was promoted based on the report findings and the relative speed in which we concluded the review.
Many of the benefits of stratified sampling may be utilized in operations where a strong reliance is placed on perpetual inventory calculations. People using perpetual counts often need to make spot checks to verify the results of the ideal usage formula. So what items should you spot check?
I would recommend checking every item in your top 25 purchased goods list. Since you won't be scrutinized by Arthur Young accountants, it's up to you to decide how many additional items need checking between physical counts. To give you an idea of the power of sampling, we used around 350 accounts in a universe with tens of thousands. Our limited review located critical control issues and we brought them to management's attention in a timely manner.
If you have 1,000 items in stock, check 5 or less shelf stable dry goods. With your top 25, this will make 30 items. Try to randomly check another 25 to 50 (depending on time required). Now the fun begins as you try to reconcile the perpetual inventory level calculated vs. the actual amount on the shelf. The first five or six spot checks will point out obvious recipe errors and yield issues. Since you're sampling you should expect problems found for a particular class of items (for example produce) may require more intensive work on the entire class.
When you find a problem with portion control items and the recipes are solid, note the dates of the last physical count and the spot check date. Mark any of these problem items for increased scrutiny. You may consider control sheets located near the walkin coolers and freezers.
The use of spot checks and sampling techniques will greatly improve results in operations where physical counts are required monthly. If you count everything each week, your mid-week spot counts may be very brief and focused. Some operators count the top 25 daily. This should suffice for most weekly count operators.
An excellent additional benefit of perpetual inventory spot checks is the refinement of recipes used in the calculations. Accurate recipe costs and ingredient yields are requirements in more sophisticated menu engineering calculations.
Click Here For More Information
Friday, June 16, 2006
Prime vs. Choice
I decided to take a look at the price differential between prime and choice grades for the popular beef cuts. The NAMP numbers for the 5 cuts are 112A, 174, 180, 184 and 189A. My source is www.foodservice.com and I used market data from early 2005 through this month. The sample includes every fourth report and my prices represent the averages. The chart shows average market cost per pound for each cut.

Porterhouse Steaks cut from prime Short Loin 174 cost 80% more than choice. New York Strip Steaks cut from prime Strip 1x1 180 cost 62% more than choice. Tenderloin looks like a bargain. Prime Tender 189A costs about 34% more than choice. Finally, a prime Sirloin Steak cut from a Top Butt 184 will cost about 8% more than choice.

Click Here For More Information
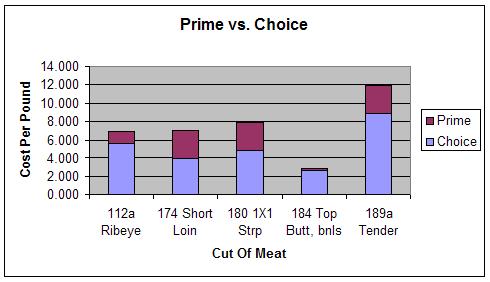
Thursday, June 15, 2006
One Dollar of Food Cost
In an earlier post Purchasing Dollar vs. Food Cost Percentage , the topic of dollar analysis of food cost was explored. When I say "dollar" in this context, I am referring to an entire year of food cost expressed in terms of one dollar.
There are many interesting ways to look at one dollar of food cost. One of the easiest starting points is vendor analysis. Find out how much of your food cost dollar is spent with each vendor. If you want to improve your overall results, start out with the top 3 to 5 vendors. Could competitive bidding or market-based pricing contracts help lower your costs with these high volume vendors?
You may want to answer this question with a more in depth view. A simple matrix could be used to analyze the dollar value by vendor for each major cost category. Every operation has certain categories which stand out. Steak houses would have a major part of their dollar spent with butchers and meat suppliers. Mexican concepts and pizzerias spend big amounts on dairy products and sauces. The dough ingredients and tortillas are high on their list.
The matrix would have a row for each major category. Many use the following categories: meat, seafood, produce, dairy, dry goods, frozen goods, breads and baked goods. I recommend a more focused list. A QSR chicken concept might have a category called fryer items. The actual ingredients in the category could include chicken tenders, frozen fries and the 35# containers of fryer oil. A pizza concept might have dough components, sauce components and toppings as their rows. Try to visualize the operation by production function.
Your top 3 to 5 vendors would make up the columns.
The entire matrix should equal one dollar. Find out which vendors supply you with the ingredients used in each phase of production. It's common to find cells in the matrix with values greater than or equal to a quarter. These cells are high impact activities. Focus your attention on these areas and vendors first.
On the other hand, there will be many cells with values below five cents. Don't devote excessive time on these activities. The use of flour would be a low level activity in many operations. If you make pizza dough or have a major bakery, flour could be part of a major impact cell.
Rank the cells and attack the big parts of your food dollar first. You'll get results faster with less effort.
Click Here For More Information
Friday, June 09, 2006
Market Segmentation - Best Practices
Over time, I have observed many segments of the food and beverage service industry. My observations have included hotels, restaurants, clubs, schools, jails, health care facilities, remote sites, markets, event caterers, and race tracks. Without fail, each operation exhibits a specialty when cost of goods sold and inventory control are the focus.
The best practices I've observed do not represent any scientific study and I have no statistics to support my opinions. These are gut feelings which are the result of many years of observations. I hope you find them useful in your organization. Before adding any of these control features to your operation, make sure the cost justifies the benefit.
Hotels
Hotels are typically adept at inventory control and profit center reports. Most hotels have a central receiving area. Movement of product from central locations is tightly controlled using requisitions and transfers. Some hotels implement an approval system with order limits for each purchase category. They setup strict guidelines for approvals.
The best run hotels can tell you how much of each controllable is on hand at a given point in time (by location).
Hotels are frequently buffet shops and many have at least 40% of food sales in banquets and buffets. This high level of buffet activity helps keep waste at a minimum in the well run operations.
Restaurants
The best run restaurants have a focused menu and they know their customers well. Some actually create table profiles and they can quote statistics on average check by meal period, average sales per table by meal period and by wait person. A few top level f&b controllers know table profiles and use these in demand forecasts.
Restaurants tend to be adept at specials and the best do a fantastic job putting extra profits in the cash register. Today's POS systems have a battery of focused sales reports which help managers price menu items and track usage.
Clubs
Clubs are often hybrid operations with both restaurant style service and banquet service. The best clubs do a great job segmenting the two operations. Purchasing demands a knowledge of the entire operation. The best club managers are aware of upcoming events and seasonal restaurant trends. I'll discuss ordering for events below.
The members of any club are the focus and many members are regulars. This fact accounts for a more stable forecast model. Knowing the clients intimately helps to reduce waste caused by over ordering perishables.
Institutional Caterers
At Sodexho, we served clients in remote construction and mining sites, health care, business and industry and education. To a lesser extent, we fed prisoners in a small number of jails. Contract feeders and self-operated institutional accounts are driven by cycle menus. These contract menus specify menu options for each meal period in a four or five week cycle menu. This activity is dominated by firms with highly automated systems for tracking item usage. Brand name items often attract rebate income. Institutional feeders are wizards at setting up rebate programs and monitoring their results.
In my role with Sodexho Canada, I setup rebates for coffee, paper, chemicals and other high volume, rebate sensitive items. These rebates accounted for 2.5% of food purchases.
Some savvy self-op shops establish relationships with manufacturers and generate rebate activity. Even though each single account may not have the typical volume required, buying groups allow these single operations to combine their volume to hit a critical mass.
Institutional food service has two huge advantages: menu is fixed and demand is easily estimated. Sometimes, brutal competition for top accounts places a huge demand on the cost control system. The benefit of this tight control is achieved on contracts gained through less stringent conditions. High profits are bagged through implementation of the same tight control systems.
Markets
Take home food is a fast growing area and the super markets have created special areas to promote this high profit activity. Although these venues may help minimize waste of perishables in the produce, deli and meat aisles, many top market operations produce items in separate facilities with ingredients purchased specifically for this purpose. Like any food and beverage operation, they benefit from larger volume purchases and purchase #10 cans instead of the smaller sizes purchased by super market shoppers.
These operations often use the new outlet to promote higher quality goods and they charge higher prices. The best run operations sell their finished goods to the deli, baked goods area and produce managers. In a complete twist, they supply the market more than they "buy" from the market.
Event Caterers
The event caterers know how many are to be served and the exact menu items required. These operators try to buy just enough to produce the menu for the event with a minimum of waste. Event reports highlight the count, menu items to be served and raw ingredients needed to produce the finished products.
With tight control of purchases and next to nothing purchased for par, low percentage food costs are the norm. Buffets allow these artists to use small leftovers from previous affairs with common starch items and salads.
Race Tracks
I grew up in Saratoga Springs and I worked for Harry M. Stevens. This company was founded by Mr. Stevens when he went to Yankee Stadium and couldn't buy a hot dog. During my college years, HMS was the top concessionaire for many sports facilities and one of the founder's grandchildren married into the Gulden mustard family.
In addition to lots of hot dogs, beer, soda, fries and chips, Saratoga Race Track served an excellent clam chowder, corn on the cob, clams on the half shell and specialty drinks. Concessionaires know their operations well and they plan weeks ahead for major events.
In Saratoga, we have the Travers Stakes race and there are many huge sporting events annually in the country. Now the NASCAR racing circuit produces huge events each weekend. The Triple Crown and Breeders Cup Day are big horse racing events with huge turnouts.
Concessionaires in New York ship employees from Aqueduct in Queens, Belmont Park in Long Island and Upstaters from Saratoga to create well trained staffs ready for these major days.
Overview
Each operator tends to focus on the business model of the particular segment. This focus brings certain specialized strengths into play. It has been my privilege to see so many different segments over the years. I often wonder what food cost percentage could be achieved with the best people from all these diverse areas of the food and beverage universe.
Saturday, June 03, 2006
Ideal Cost of Sales - Decomposed
In the last 15 years, I have worked on over 200 projects to determine ideal usage and ideal menu item prices. In candor, most firms lack the proper operations information to explore the ideal cost issue. While the technology has completely transformed the reporting environment, the lack of standard recipes, standard yields and standard production information is widespread.
At the very least, every operator should know the portion sizes for all top menu items. I always say: "Pretend you just hired me as a line cook. Where do I go to study the portion guidelines for the really popular stuff?" A surprising number of managers answer: "You need to ask the people your working with for the guidelines." Leaving key portion size information to informal word-of-mouth communication is a mistake.
Take your top 25 purchased items. For each item, create a yield sheet as follows:
Cost of purchased weight:
As purchased weight:
Primary purpose yield:
Secondary purpose yield:
Trim yield:
Bones yield:
Unusable weight:
The cost for both the primary purpose yield and secondary purpose yield depends on your ability to make use of the trim and bones. If you have no use for either trim or bones, do not give a dollar credit in the analysis. A conservative model would also give a zero credit for these weights. A more aggressive model would assign a credit for the trim and bones based on the actual cost of buying each from the butcher. Do not assign a credit for trim and bones using straight weight calculations.
Costing the primary purpose yield and the secondary purpose yield is at the heart of this analysis.
I was in the local Costco today and boneless ribsteaks were selling for $7.49 per pound. Recently, I had purchased a bonein rib roast for $4.99 per pound. My best guess on the trim level of both cuts made me happy I had made the buy at $4.99. The bonein roast looked like it was cut from a 109C and the boneless steaks looked like they were cut from a 110. The difference in weight is a ratio of 80% usable on the bonein. If you want a perfect 112 ribeye, 50% loss from a 110 is possible and you would pay up to $9.98 in my example.
Since I paid $21 for my 3-rib roast and I cut three thick rib steaks, my cost of $7 per steak was a second check. In deed, the steaks at Costco would have cost me $8.25 each.
Early in my consulting practice, I worked with a fantastic person with formal butcher training and lots of experience. He bought beef rib after carefully studying the various market options from 3 suppliers. His typical spec was 109D or "exports" as they are called. Occasionally, he would buy the 109 or 110. In his operation, he served both prime rib and rib steaks so he often purchased more than one cut. His butcher shop had all the proper equipment.
Some of the decisions he made would produce a savings of 10% to 12% for the same menu item during the same week. Since these menu items accounted for over 20% of his weekend business, these decisions put him at a big advantage to his competition. He always passed along the savings to his customers in the prime rib since this was a market priced special on his menu (offered only on the busiest nights).
In the years following this project, I observed many restaurants offering prime rib and rib steaks. Many operators offered prime rib on slow nights, bought the meat from a single supplier and always bought the same cut. Seeing the unserved leftovers in their walkins was my first red flag. The lack of serious yield analysis was the second red flag. Finally, the majority had no clue what the gross margin was on these very high cost menu items. It was no wonder they called for help.
An operation with poor forecasts, no formal yield data and a complete lack of competitive bidding in place can easily pay twice as much to serve the same menu item. The great reports now available show the variances clearly. Ironically, the majority of operators using an ideal usage report look at super high variance ingredients with suspicion. "This can't be right!" "What is this telling me?" and "How can you believe this stuff?" are common replies.
Click Here For More Information
Friday, May 26, 2006
Menu Analysis - Decomposed
When I studied Finance in grad school, our textbook Managerial Finance by J. Fred Weston covered portfolio theory. In a chapter appendix, Dr. William Sharpe's Capital Asset Pricing Model was presented and the calculation of beta coefficients was the focus. In my corporate position, I used the CAPM to analyze operating margins of our hard dollar catering contracts in Sodexho Canada. You can find many applications for portfolio theory in everyday business.
Menu analysis lends itself to portfolio theory. Think of your menu as a portfolio of selections offered to customers. Today's POS systems provide lots of great data to analyze. Tracking menu item gross margin vs. total menu gross margin can be quite helpful. Imagine a popular menu item with a volatile ingredient like crab meat vs. another menu item which utilizes a price stable ingredient. CAPM would assign a high beta to the crab cakes.
My clients have some huge concerns when they start tinkering with their menus. One example of this concern: "If I drop this dog, I'm worried the few fans will go somewhere else and take their family with them to a competitor." Some fearlessly raise the price of coffee, iced tea, soda, and bottled water yet dread raising certain items over a particular threshold. Perhaps they can't imagine charging over $10 for an appetizer or over $20 for an entree.
Whether you choose to try CAPM, menu engineering or just use a gut feel, menu changes are huge events. Simple adjustments for inflation can send super price conscious patrons to the competition.
One of the best discussions I ever had regarding menu analysis took place with a person who never attended high school. He was very worried about raising his entree prices at dinner above $9.95. The year was 1993 and many of his competitors had made the move. We discussed the menus of area restaurants all day.
During our discussion, I mentioned one of the low cost competitors ($8.95 and below) seemed to be in decline. Their parking lot was spotty on peak nights and bare early in the week. The response: "Nobody knows why they go there!" We really tore this point up. The menu had zero focus. This restaurant served pizza, pasta, burgers, pita sandwiches, tacos, chicken fingers, 8 oz. steaks and fried shrimp. Simply stated, there wasn't a fad they didn't mimic.
While my client employed a strategy of a tightly controlled 40% food cost on a BBQ menu, this competing restaurant had no formal strategy. They simply added new menu items as eating habits changed. Watching the lines out the door waiting for a BBQ fix on a rainy Tuesday, I quickly converted to the focused menu camp. The competitor closed two years later.
No amount of mathematics can solve the riddle of the restaurant with no soul.
Monday, May 22, 2006
Food Purchasing - Decomposed
Your purchasing decisions have the greatest impact on the food cost percentage. When I refer to purchasing, I do not mean expediting vendor orders. Often, poor forecasting can turn the purchasing function into a frenzied group of expeditors. The more time the purchasing team spends on follow up calls, the less time is available for vendor analysis, material standardization and negotiation.
Your purchasing director should have the time and resources necessary to perform the critical tasks of this function. The best purchasing directors are market savvy and have standard costs for all major items. These pros focus on tiny windows of market opportunity and make larger purchases when the conditions are favorable. Due to the perishable nature of many food items, they need to be completely aware of usage trends and near term forecasts.
I find the purchasing directors often have either a poor relationship with the executive chef or a phenomenal relationship. The great relationships produce the best results. These teams discuss upcoming demand and alternate specifications. The purchasing pros handle the supplier negotiations. The chef handles the menu and demand forecasts for key items.
In the manufacturing environment it is common to use an ABC stratification system. The "A" parts represent 10 to 15% of items and 70 to 75% of purchase volume. The "C" parts represent 70 to 75% of items and less than 10% of purchase volume. In the middle are the "B" parts. Typically, purchasing agents focus on the "A" parts and setup long term contracts with suppliers and manufacturers. A greater planning effort is devoted to the "A" parts.
Switching to our industry, I've found the top 25% of items will encompass a very large percentage of purchase volume. Depending on menu focus, their coverage varies from 60% to 90% of total purchases. If you study these items carefully, you will see three conditions develop.
The first condition will include items which seldom vary in price per pound or case. These items are plentiful, shelf stable and easier to monitor. Some items will vary depending on season and temporary weather conditions. Volatility is high when moving in and out of season. Finally, some items change in price constantly due to a variety of variables.
Within the top tier of items, often further stratification may be performed to isolate the top 10 or top 25 items. I would make an additional recommendation. Spend slightly less time on the items with steady price trends. Focus more efforts on the volatile items. Secondly, spend significant efforts on forecasts for items with very low shelf lives. Overstock of highly perishable items is to be avoided if at all possible.
A solid purchasing team with proper resources can make a major impact on your overall food cost percentage. It is possible to buy 10% less food for the same menu and sales level. For example, I have seen a company without a well managed purchase function drop from a 40% food cost percentage to a 36% figure. Similar results have been achieved by operators across industry segments.
A big question always comes up regarding the cost of such and effort. Most multi-unit groups have a well developed purchasing function since the numbers speak for themselves. Find the balance between the cost of improving purchasing results and the benefit using a simple formula.
Multiply your most recent 12 months of purchases by 10%. This result is the break even budget for a qualified purchasing director. Compare your result against HR market studies in your region.
A $3,000,000 volume of food sales with a 40% food cost percentage would justify an annual expenditure of $120,000 at break even. If you could hire a competent professional for $75,000, you would see a $45,000 benefit. That's a net benefit of 1.5% of sales. If your growing the concept, the return on investment will increase as your units increase since the benefit of purchasing efforts is multiplied by the group volume.
Click Here For More Information
Tuesday, May 16, 2006
Utilizing Specials
When the walkin cooler gets overloaded with one or more perishable items, the chance you won't turn your inventory dollars into tomorrow's profits increases. Several tactics may be employed to deal with this issue. My least favorite is the blowout. A blowout is typically the top special promoted aggressively by the waitstaff. It is common to offer the special at a discount to the median entree price.
Most blowout menu items involve an ingredient about to spoil. You're actually motivating your sales team to sell an entree made with ingredients well past peak. This picture is very different from the ideal special.
Specials can be excellent devices for testing new menu ideas. Many chefs try to promote super fresh, seasonal items using their top special of the night. On the customer side, lots of people like to try new items and everyone can be persuaded to order a popular seasonal dish.
As you ponder the use of a blowout as your special of the day, try to imagine the impression you will make on the customers. Those customers who frequently order a suggested menu item are statistically most likely to be disappointed. Unlike the customers who normally order off the main menu, they may be less forgiving of one substandard meal.
Too many competitors are effectively utilizing specials. A poorly executed blowout could cause negative word of mouth and hurt future business.
Saturday, May 06, 2006
Inventory Control - Decomposed
A decade before spreadsheets, inventory forms would be produced from copiers each count period. The count team would often take their counts with no knowledge of the previous count or the current replacement cost. Once the sheets were turned in to the office, a team of accountants would update the unit costs and extend the counts to reach a value.
This costing method is a hybrid of the FIFO method. Since the staff would pull recent invoices for pricing information, they were closely approximating the pure FIFO value. Most inventories were rapidly calculated with calculators and streams of tape could be found on the floor and in waste baskets.
Today, many operators use spreadsheets in place of the copied forms and adding machine calculations. Where do the current operators go to find the prices to use in extensions? I always ask how people get their numbers and the responses are quite varied. Some people use the most recent costs much like the way mentioned above (last cost method or FIFO hybrid). Others don't bother to look up new prices. They use the same numbers from the previous inventory (old cost method or hybrid LIFO). A few ambitious souls go to the trouble of looking up all prices from a two week period. They use average prices (average cost method or hybrid FIFO).
On some spreadsheets, the analysts enter count numbers in columns with beginning inventory, received (often by day of week) and ending inventory. The net counts (i.e. BI+R-EI) are multiplied by a single number. The source of the numbers vary by operation.
I'm not a fan of this method. When I passed the CPA test in 1981, inventory valuation issues dominated the theory section of the test. It would be difficult for even the most aggressive CPA firm to allow the period-end purchases to be ignored in determining inventory valuation. There is currently a big discussion involving elimination of LIFO valuations. LIFO is effectively banned in England for inventory valuation.
By presenting purchases according to GAAP, many restaurants will improve their food cost figures and present better reports to the executives. I recommend valuing ending inventory based on FIFO. In addition, a prudent reserve for spoilage should be calculated and used as an offset to the asset value on the balance sheet.
Your month end inventories should not be altered with WIP figures which can't be substantiated. A fully cooked prime rib roast which wasn't served the previous night should not be valued highly. Freezer burn could lower the value of lobster tails, shrimp, fin fish and meat. Don't value items which may only be used in a soup the same as those received fresh the same day.
Inventory valuation should be consistent from period to period. The value should be conservatively calculated. Counts should be accurate and the counting day should be delivery free if possible. It is best to use count personnel who have no role in purchasing and production.
Expensive items should be counted frequently. The month end accounting cutoff should produce few surprises on your top 25 items (often the top 25 items will account for over 50% of annual purchases). Daily counts on these key items will eliminate most inventory errors and will improve ordering and usage results.
Spend a lot of time designing count sheets for the freezers. No mathematical calculations should be performed while shivering count teams go through the shelves. The sheets should include every possible way to count the critical inventory items. Shrimp 16-20 may be on the sheet as case, box, pound, tray (for pre-portioned menu items) and portion. Just enter the counts and present the F&B controller with the sheets. Standard ratios should be used for portions.
Spend more time in the freezer than you do estimating the amount of dry spices in the containers. Some chefs expense spices and keep expensive saffron under lock and key. Check dates on any package with a date. Don't do this every month in the dry storage. Make a rotation schedule for these items. I've seen expiration dates more than a year past on some dry stock.
Count the stock early in the morning if possible. I am totally against the beer guzzling crew waiting for the door to close on the final customers before racing through the counts. Unfortunately, this happens too often.
Finally, if you want your inventory valuation to have more meaning you should count all stock weekly (on Monday morning). Consistently calculated weekly inventories will help you focus on chronic cost issues like over buying and over portioning and keep discussion of inventory errors from the management meetings.
Subscribe to:
Posts (Atom)
Restaurant Data Pros


